From Chief Investment Officer Tom Veale,
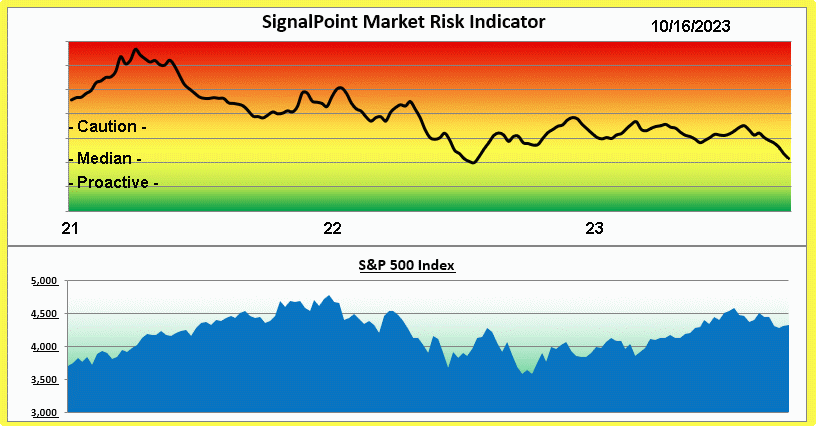
Sometimes doctors recommend having an MRI scan when they suspect something but can’t make a determination in a non-invasive way. SignalPoint’s Market Risk Indicator is similar. It’s a way of looking at market risk internals for a prognosis as to what might be expected. For several weeks we’ve watched the SignalPoint MRI decline in its risk summary and it did so again this week.

The MRI has returned to its median value for the first time in over a year. While a year ago it didn’t herald an immediate turn-around in the markets, it did suggest the possibility of reasonable returns over the next year. The bright yellow border of this week’s histogram suggests that upside potential is well balanced with downside risk. It took the consolidation from the 2023 market highs to current levels to scrub higher risk from the markets. This week’s data shows none of the four components being in their ‘cautious’ territory. Two show data in their ‘proactive’ range, indicating they’re each a full standard deviation away from their median values.
It remains to be seen how Q3 and Q4 of 2023 will turn out. There will be lots of speculation about such results in the coming weeks. At SignalPoint we’ll be monitoring how those results affect market risk and will respond as we see how our portfolio strategies are affected.
Best regards,
Tom Veale
This week’s MRI comes in at 26, its median value. The MRI Oscillator shows a minus 2 indicating slight, continued downward risk pressure. Two components are in their neutral territories and two are showing ‘proactive’ readings.


