From Chief Investment Officer Tom Veale,
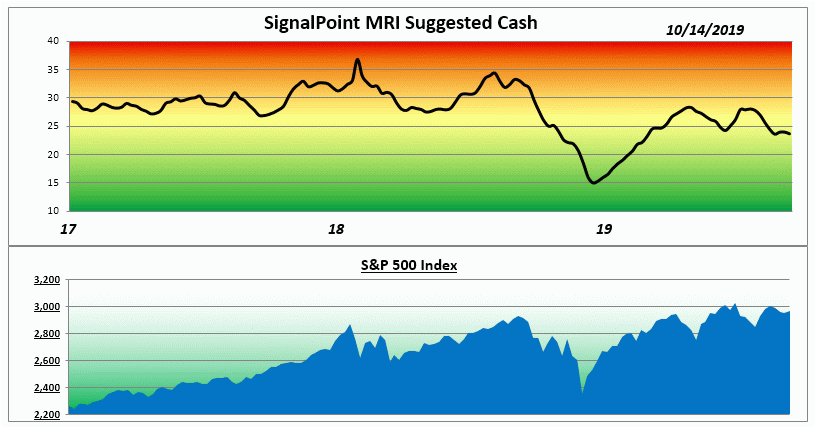
“As last week’s trading came to an end markets were giddy with enthusiasm over potential for at least the first round of trade talks between China and the U.S. It seems the Tariff Pendulum can’t swing very far before someone hits it with a baseball bat. Trading left our Market Risk Indicator’s components with two unchanged and two falling in risk. Both Relative Valuation and Speculation both reside in the threshold of being bullish this week with the other two being neutral. The MRI remained unchanged this week at 24% suggested cash as a reserve for diversified stock portfolios. The MRI Oscillator is negative one, suggesting only mild downward pressure on risk.”

“Markets can still rise with the yield borderline bearish if Yield vs ST Rates still favors stocks (2004 to 2007). Note the hugely bullish signal from 2008-09’s market bottom. Last December’s market decline spiked median yield above 2.5% giving a bullish signal just as the markets bottomed.”
The Market Risk Indicator is an assessment tool that serves as a guide through all markets as to the prudent use of a liquid cash cushion. It helps determine an approximation of the amount of cash reserve relative to a diversified equity portfolio. (this is depicted by the graph above)
At times of high risk in the market, the MRI will suggest a higher level of cash reserve. At times of low market risk, the MRI will suggest a lower level of cash reserve. This investment process helps to measure and manage market risk.
Because of this, the fear associated with the uncertainty of the market can be replaced by the security of a sound investment strategy.


