From Chief Investment Officer Tom Veale,
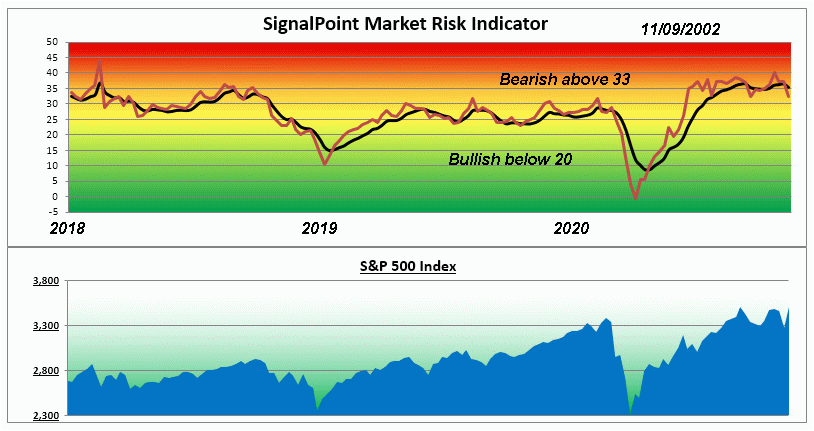
“SignalPoint’s Market Risk Indicator (MRI) declined one point to 35 this week as both Relative Valuation and Speculation indexes came in lower than the previous week. Slight rises in our Divergence and IPO/New Issues indexes were small enough as to not offset the other two components. The MRI Oscillator dropped to minus 5 indicating declining risk profile overall. This is Week 16 of the MRI remaining bearish.”

“Only the IPO/New Issues index remains bearish this week. It is where the most speculative money is currently flowing.
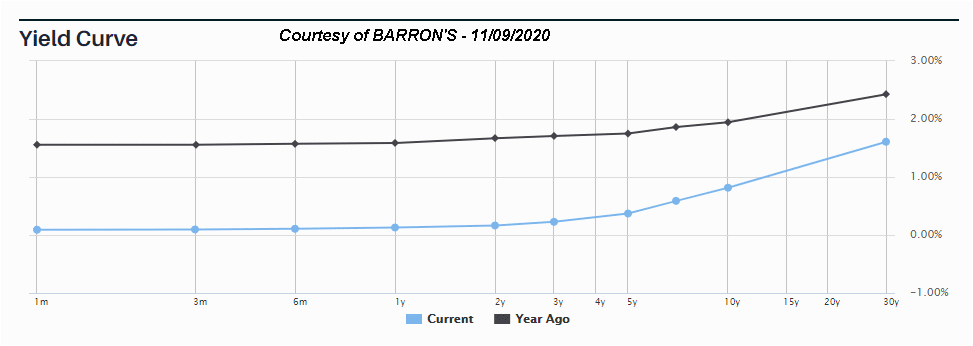
Value Line currently shows a 2.3% median yield for the next 12 months for all dividend paying stocks. Compare that to the view of the current Treasury Yield Curve below:”

“As you can see there is no point on the “Current” curve that approaches what the yield is on dividend paying stocks. The potential for inflation eating up the principal value of treasury based income portfolios is real. Diversification to include some corporate and REIT income components is a possible solution.”
The Market Risk Indicator is an assessment tool that serves as a guide through all markets as to the prudent use of a liquid cash cushion. It helps determine an approximation of the amount of cash reserve relative to a diversified equity portfolio. (this is depicted by the graph above)
At times of high risk in the market, the MRI will suggest a higher level of cash reserve. At times of low market risk, the MRI will suggest a lower level of cash reserve. This investment process helps to measure and manage market risk.
Because of this, the fear associated with the uncertainty of the market can be replaced by the security of a sound investment strategy.


