From Chief Investment Officer Tom Veale,
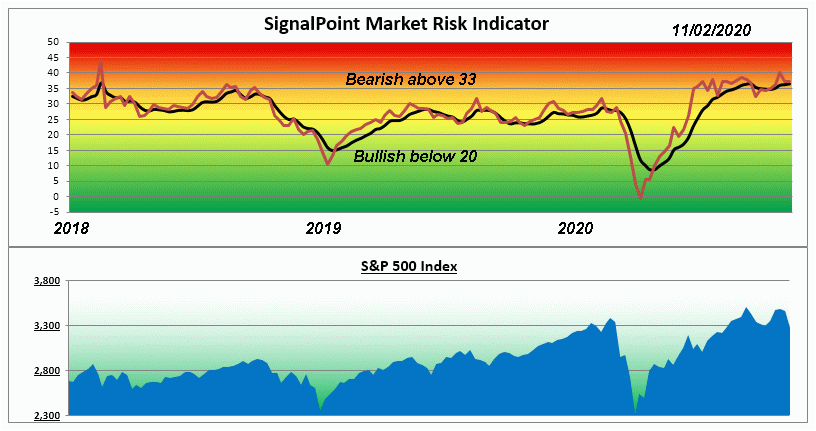
“In an attempt to add another hill to the Market Roller Coaster, October closed on a down beat. However it is encouraging to note the NASDAQ Composite and the S&P 500 are both still in positive territory for the Year-to-Date. Our SignalPoint Market Risk Indicator again calculates to be bearish for the 15th week. It remains at 36, a solid 4 points above Neutral territory. The MRI Oscillator is a modest +1 indicating only slight upward risk pressure.”

“The two high risk components contributing to this situation are our Relative Valuation and New Issues Indexes. Both persist in their own bearish territories.
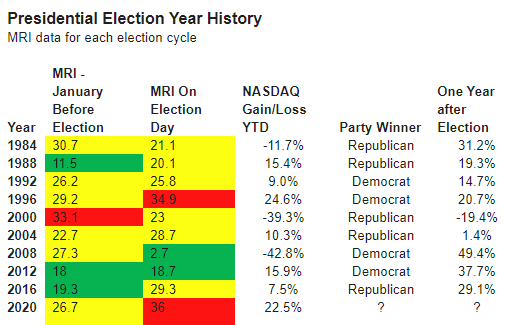
In looking back at the various U.S. Presidential elections since the Market Risk Indicator started keeping data (1982) we don’t find a clear “winner” relative to market performance. The Market Risk Indicator seems to have been a little better at predicting market performance than the election cycle.”

“While too small a sample to really have a good feel for its predictive nature it seems as though bullish conditions make for better results than bearish ones. Wouldn’t it be nice if it were as simple as knowing which party sits in POTUS position to know how well the markets will do.”
The Market Risk Indicator is an assessment tool that serves as a guide through all markets as to the prudent use of a liquid cash cushion. It helps determine an approximation of the amount of cash reserve relative to a diversified equity portfolio. (this is depicted by the graph above)
At times of high risk in the market, the MRI will suggest a higher level of cash reserve. At times of low market risk, the MRI will suggest a lower level of cash reserve. This investment process helps to measure and manage market risk.
Because of this, the fear associated with the uncertainty of the market can be replaced by the security of a sound investment strategy.


