

From Chief Investment Officer Tom Veale,
“Continuing upward risk pressure on SignalPoint’s Market Risk Indicator (MRI) is seen again this week with the MRI suggested cash level for diversified stock accounts rising another point to 26%. Further, the MRI Oscillator is now +6, the highest it’s been since it spiked in early August, 2019. That time it was driven almost entirely by our Divergence Index. This time again the Divergence Index has gone bearish but two other components also rose in their respective risk ranges.”
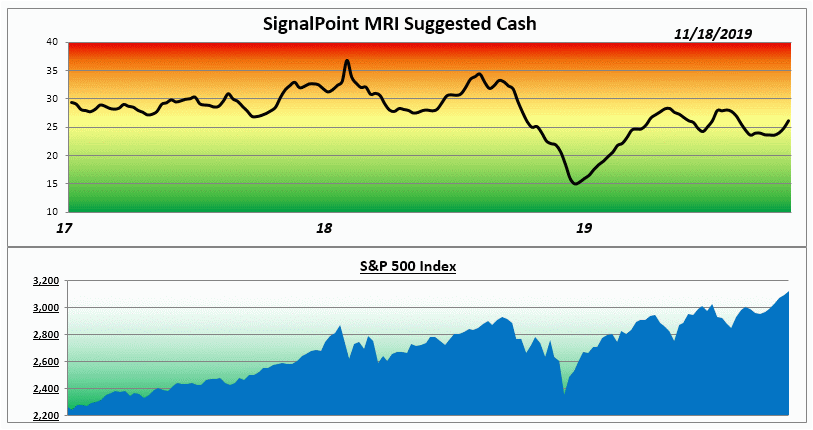
“26% cash is the median value of the MRI since 1982 so not so worrisome itself. The Oscillator suggests continuing risk pressure should things remain as they are. Helping to confirm the Divergence Index’s position is a weakening of the market’s breadth. Last week advancing and declining stocks about cancelled each other. This speaks to the nervousness of investors as stock indexes reach all-time highs.”
The Market Risk Indicator is an assessment tool that serves as a guide through all markets as to the prudent use of a liquid cash cushion. It helps determine an approximation of the amount of cash reserve relative to a diversified equity portfolio. (this is depicted by the graph above)
At times of high risk in the market, the MRI will suggest a higher level of cash reserve. At times of low market risk, the MRI will suggest a lower level of cash reserve. This investment process helps to measure and manage market risk.
Because of this, the fear associated with the uncertainty of the market can be replaced by the security of a sound investment strategy.