From Chief Investment Officer Tom Veale,
…….average risk doesn’t mean “no risk”………
“That statement from last week’s Market Risk Report was modestly prophetic, I guess. It’s rare to see the broad stock indexes fall at the rate experienced through last Friday. Several of SignalPoint’s Market Risk Indicator (MRI) components were affected by the selloff. Here’s how it looks when the data is examined:
1- The Relative Valuation Index dropped from 19.92 to 18.84. Most of that change came from Value Line’s P/E dropping from 18.0 to 16.9. The 13 Week Treasury Coupon rate remained nearly unchanged and only a mild CPI upward move was noted in the most recent data. (Bearish above 21.8, Bullish below 18.0, Median = 19.9)
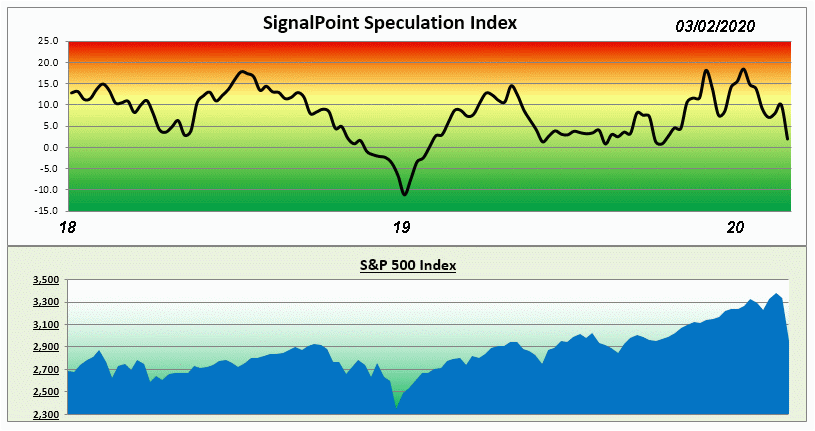
2- SignalPoint’s Speculation Index dropped from 10.0 to 1.9, nearly crossing into Bullish territory. To make the Value Line “Worst Performers” list took a 36% drop in the latest week compared to a week earlier when it took just a 25% drop. To make the “Best Performers” list now takes around 26% rise while a week ago it took a 37% gain. These changes in just a week are quite rare. (Bearish above 20, Bullish below Zero, Median = 9.2)
3- While our Divergence Index moved up just slightly, the statistics which drive this index did a complete about-face. Just 322 new 52 Week Highs were registered last week compared to 2082 stocks hitting new Lows. A week earlier the numbers were 1017 New Highs and 309 New Lows. Divergence remains in its neutral range. (Bearish above 5.4, Bullish below 1.6, Median = 3.5)
4- No noticeable change in IPO activity was recorded. I’m sure the current market conditions are such that initial public offerings being considered will most likely be postponed until more favorable times. (Bearish above 2.4, Bullish below minus 1.8, Median is Zero)
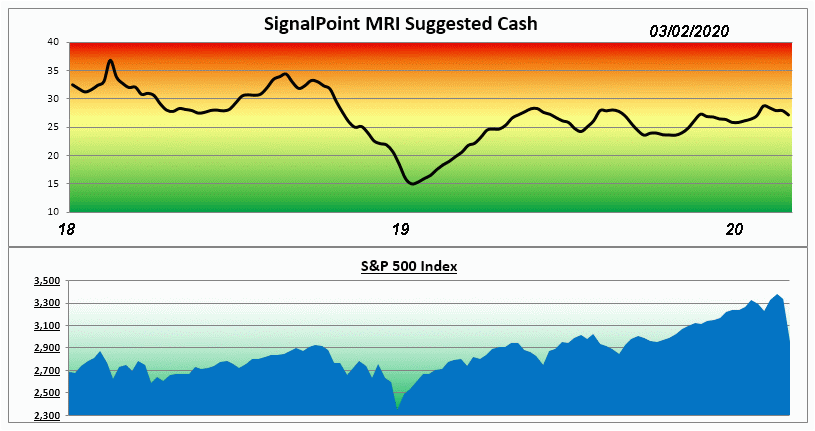
The MRI’s weekly calculations include data smoothing to help filter out market “noise.” This had the MRI drop just one point to 27% suggested cash for the current week. If we eliminate the smoothing, the MRI would have dropped from 28% to 24% – not quite bullish but below the median value. The MRI Oscillator is minus 4 indicating a strong decline in market risk. (Bearish above 33%, Bullish below 20, Median = 26)”

Here’s how the Speculation Index looks after last week’s data is reviewed:

“The Bullish cross-over for Speculation is at zero, so we nearly got there with just last week’s selloff. As can be seen we were quite close to the bearish threshold of 20 around the start of the year.
We start the first week of March with all four components neutral and Speculation nearly to its bullish range. The overall MRI is also neutral. With all the attention being paid to certain illnesses, short term traders seem to be focused only on worst case possibilities. In the meantime the MRI sees some potential for longer term gains.”
The Market Risk Indicator is an assessment tool that serves as a guide through all markets as to the prudent use of a liquid cash cushion. It helps determine an approximation of the amount of cash reserve relative to a diversified equity portfolio. (this is depicted by the graph above)
At times of high risk in the market, the MRI will suggest a higher level of cash reserve. At times of low market risk, the MRI will suggest a lower level of cash reserve. This investment process helps to measure and manage market risk.
Because of this, the fear associated with the uncertainty of the market can be replaced by the security of a sound investment strategy.


