

From Chief Investment Officer Tom Veale,
“For 12 weeks we’ve had the Market Risk Indicator (MRI) at or below the Bullish threshold. Rising to 19 this week the MRI is up 2 points this week and is now approaching its neutral range. The MRI Oscillator comes in at +11 showing extreme upward risk pressure. The opportunistic buying period of the last 13 weeks seems to have run its course. While the MRI is still far from its bearish territory, it shows nicely how the indicator tracked and suggested appropriate thinking relative to market risk while bullish.”
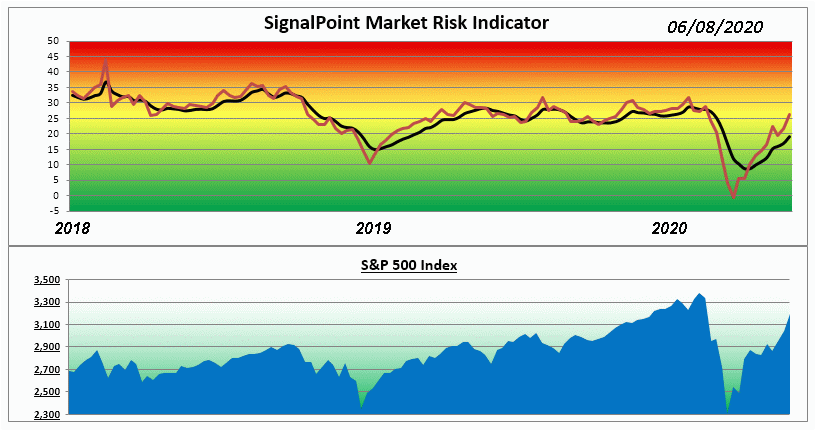
“Three of the four MRI components rose with last week’s market advance. Only the Divergence Index remains bullish. The other three indicators are in their neutral range. The Speculation Index resurfaces to its neutral range for the first time since March 13th when it first became bullish. The MRI as well as the individual index components are set with bullish and bearish thresholds at one standard deviation. This is the 12th week of the MRI being bullish.”
The Market Risk Indicator is an assessment tool that serves as a guide through all markets as to the prudent use of a liquid cash cushion. It helps determine an approximation of the amount of cash reserve relative to a diversified equity portfolio. (this is depicted by the graph above)
At times of high risk in the market, the MRI will suggest a higher level of cash reserve. At times of low market risk, the MRI will suggest a lower level of cash reserve. This investment process helps to measure and manage market risk.
Because of this, the fear associated with the uncertainty of the market can be replaced by the security of a sound investment strategy.