From Chief Investment Officer Tom Veale,
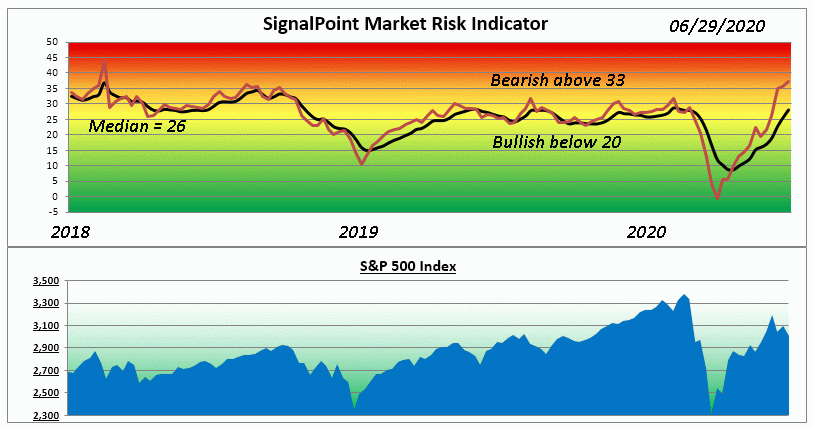
“In recent weeks we’ve seen the Market Risk Indicator’s Oscillator value showing exceptional upward risk pressure. This week the MRI Oscillator is +14 and once again showing very heavy upward risk pressure. This pushed the MRI itself up another two points to 28 and 2 full points above its median value. While not yet high risk, it’s the highest the MRI has been since before the start of Coronavirus.”

“It’s a split decision on the MRI components with our Speculation Index coming in bearish while the Divergence Index shows a bullish value. The other two are neutral. The bearish Speculation value is less threatening because of the source of its database. It’s based in a 13 week look-back. So, we’re currently looking at the end of March, 2020 for comparison and at that time the Speculation Index was bullish to an equal extreme.
It is difficult to relate media headlines to how the markets are performing. It’s at such points in time that measures such as the SignalPoint MRI become valuable in filtering what is important for investors from what is background noise. Right now we are watching unnaturally depressed interest rates while also watching inflation via the Consumer Price Index. We are concerned about the willingness of investors to funnel their money into high priced bond funds of nominal yield as a “flight to safety” move. Currently the median yield of all stocks with a dividend in Value Line’s 1700 stock universe is 2.4%. When compared to iShares’ 20+ Year Treasury Bond fund (TLT) and its yield of 1.95% we see no compelling reason to shift assets to long bonds for income or safety right now.
We continue to monitor media headlines for events beyond the MRI’s view. With second quarter financial reports on the horizon we’ll soon be hearing what effect C-19 has had in a measurable way.”
The Market Risk Indicator is an assessment tool that serves as a guide through all markets as to the prudent use of a liquid cash cushion. It helps determine an approximation of the amount of cash reserve relative to a diversified equity portfolio. (this is depicted by the graph above)
At times of high risk in the market, the MRI will suggest a higher level of cash reserve. At times of low market risk, the MRI will suggest a lower level of cash reserve. This investment process helps to measure and manage market risk.
Because of this, the fear associated with the uncertainty of the market can be replaced by the security of a sound investment strategy.


