From Chief Investment Officer Tom Veale,
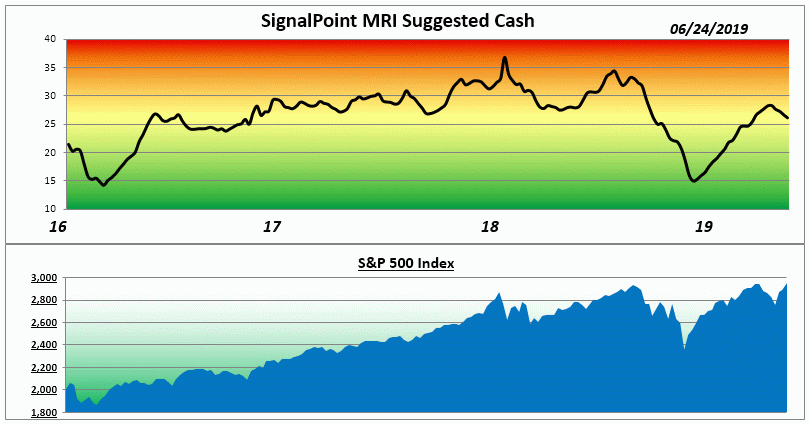
“A better week’s trading was seen last week with advancing stocks outpacing decliners by roughly a 2:1 margin. This cascaded over to the 52 Week Highs and Lows with that statistic improving as well. Our Divergence Index has finally dropped back to a neutral ranking after 6 weeks of hand-wringing. Even with a slight uptick in our Relative Valuation Index the Market Risk Indicator (MRI) dropped another point to 26% suggested cash for diversified stock portfolios (the Median value since 1982).”

“With all four MRI components now neutral and the MRI Oscillator still showing minus 1 (slight downward risk pressure) it is not surprising to see the stock market indexes rising. Our Speculation Index remains at the low end of its neutral range suggesting no current overheating in the markets. All this has been happening even as the headlines have been unfavorable on several fronts. Concern over Middle East tensions, Fed Watch worries and unresolved tariff issues have been put aside for now as a rare Summer rally has returned indexes to near record highs.”
The Market Risk Indicator is an assessment tool that serves as a guide through all markets as to the prudent use of a liquid cash cushion. It helps determine an approximation of the amount of cash reserve relative to a diversified equity portfolio. (this is depicted by the graph above)
At times of high risk in the market, the MRI will suggest a higher level of cash reserve. At times of low market risk, the MRI will suggest a lower level of cash reserve. This investment process helps to measure and manage market risk.
Because of this, the fear associated with the uncertainty of the market can be replaced by the security of a sound investment strategy.


