Market Risk Report as of February 6, 2023

From Chief Investment Officer Tom Veale,

If we were to attempt to list the number of news distractions vs the movement of stock prices we might have an interesting indicator. Right now we have spy “weather” balloons, earthquakes, volcanos, Super Bowl, Earth core spin reversal, freezing cold, global warming, etc. But do any of these help us decide if the markets are still the best place for our investment dollars?

SignalPoint’s Market Risk Indicator attempts to filter undesirable background noise and let us concentrate on the risk signals we find informative. The MRI, while above its median value, can be considered moderate in risk assessment. This previous week’s data drove all four MRI components downward in risk assessment. Two are actually now in their proactive ranges but are only very short term indicators and somewhat fickle. The Relative Valuation Index remains in its caution range as stock values plus either the CPI Inflation rate or the 13 Week Treasury rate put it in a tough position. It remains the single biggest hinderance for the stock indexes moving sustainably higher at this time.
 
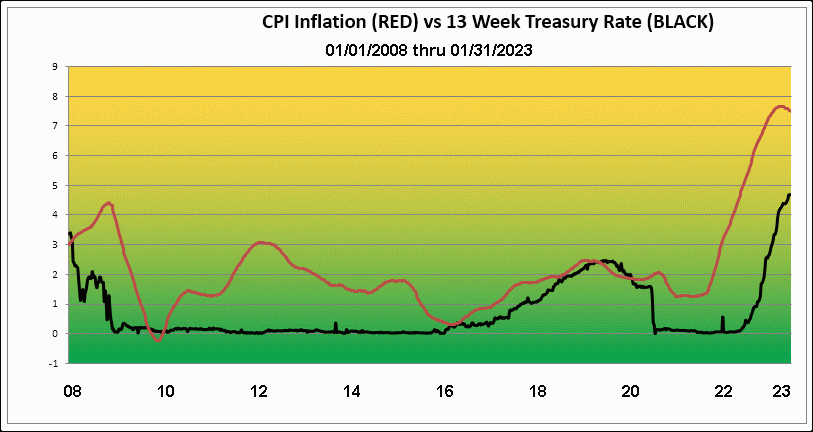
Good news for investors is seen when we look at current Treasury rates for the 13 Week coupon vs the current CPI Inflation indicator. While savers are still receiving less than the inflation rate in savings yield, we see the CPI level topping out.
Historically, until the start of the New Millennium, the short term treasury rate stayed around one point above the CPI inflation rate. It is possible we will see this return during 2023. For most of the last 22 years ST Treasuries have been offering a negative return compared to inflation. We may be nearing the time when interest rates will finally move back above inflation rates.
 
Best regards,
Tom Veale
 
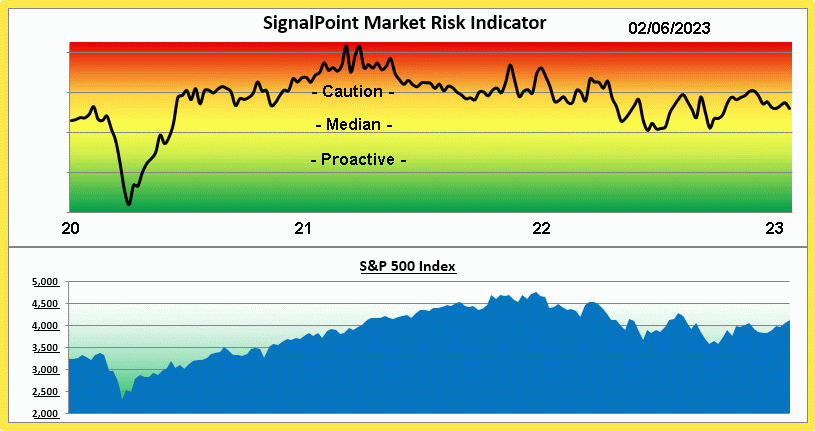
This week we see the MRI unchanged again at 30. The MRI Oscillator is showing +2 or mild upward risk pressure.
 

Share Article: