From Chief Investment Officer Tom Veale,
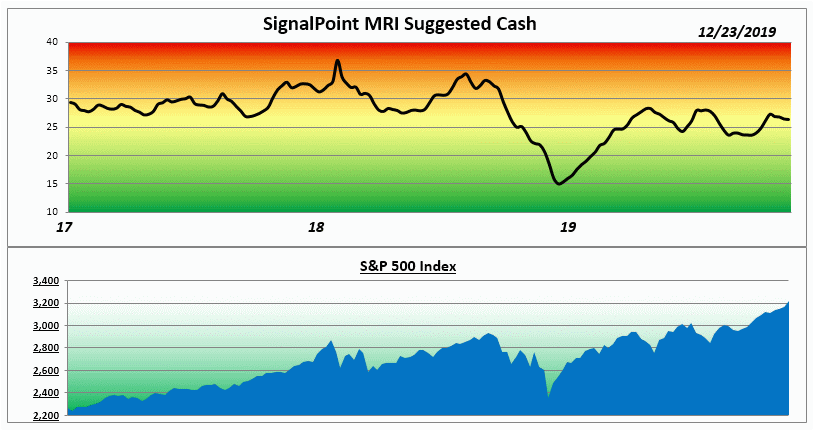
“For our Christmas Week market risk remains at 26% suggested cash for diversified stock portfolios, the median value since 1982. Most of 2019 has had the Market Risk Indicator (MRI) at or near its median value with only small deviations. This followed the excellent bullish signal at the end of 2018.”

“All MRI components remain in their own neutral ranges and the MRI Oscillator shows only mild risk accumulation with a +1 value this week.
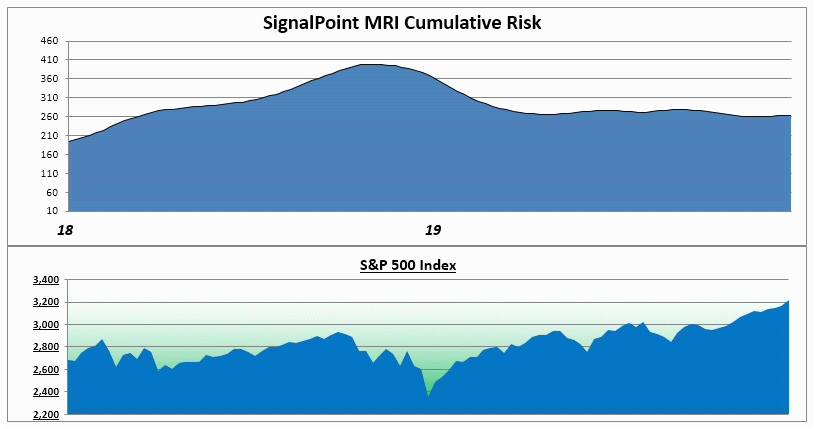
Another way of understanding how market risk is doing is to see the accumulation of risk over time. This next graphic shows “cumulative risk.” Each week the variance from Median value is added to the previous cumulative total. In this way, if market risk is quite high and bearish the slope of the line will be upward (downward for low risk markets). A flattish line indicates steady MRI values at or near the Median.”

“So, through most of 2019 we see there was little or no accumulation of risk above median value – even with a substantial rise in the S&P 500 Index over the year. This occurred even as “headlines” presented worries from inverted yield curves to trade wars and impeachment hearings. Nothing seemed to cause the Bull to stumble.”
The Market Risk Indicator is an assessment tool that serves as a guide through all markets as to the prudent use of a liquid cash cushion. It helps determine an approximation of the amount of cash reserve relative to a diversified equity portfolio. (this is depicted by the graph above)
At times of high risk in the market, the MRI will suggest a higher level of cash reserve. At times of low market risk, the MRI will suggest a lower level of cash reserve. This investment process helps to measure and manage market risk.
Because of this, the fear associated with the uncertainty of the market can be replaced by the security of a sound investment strategy.


