

From Chief Investment Officer Tom Veale,
“Some might think of market performance and market risk as opposites. If performance is good then risk must be high, etc. However, as we’ve seen over the years market risk and direction aren’t always opposing forces. This week again we had the S&P500 and Nasdaq Composite Indexes close the week at all-time-highs. The Dow 30 was also close to a record. Shouldn’t market risk also be heading higher?”
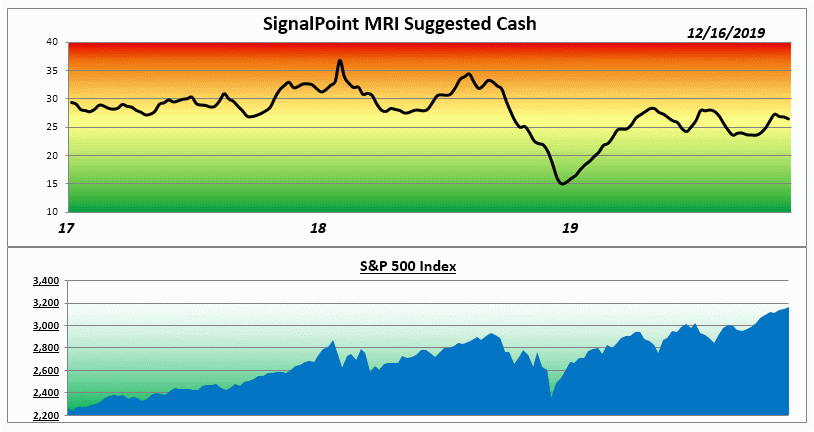
“As the graph suggests, we’ve seen the MRI steady to slowly declining for several weeks. This week the MRI is now at 26% Cash suggested for diversified stock accounts. The MRI Oscillator is zero suggesting no upward or downward risk pressure. 26% cash is the median value for the MRI and is dead neutral.
How about the MRI’s components? Are there signs of stress there? Again, all four components are in their own neutral ranges. The Relative Valuation Index moved upward along with the IPO Activity Index. Offsetting these the Speculation and Divergence Indexes moved downward. This is why no single market measure can be validated historically. It’s more convincing to have consensus with risk indicators than to follow any one of them blindly.”
The Market Risk Indicator is an assessment tool that serves as a guide through all markets as to the prudent use of a liquid cash cushion. It helps determine an approximation of the amount of cash reserve relative to a diversified equity portfolio. (this is depicted by the graph above)
At times of high risk in the market, the MRI will suggest a higher level of cash reserve. At times of low market risk, the MRI will suggest a lower level of cash reserve. This investment process helps to measure and manage market risk.
Because of this, the fear associated with the uncertainty of the market can be replaced by the security of a sound investment strategy.