From Chief Investment Officer Tom Veale,
“Sometimes the week before a national holiday will affect what we see in the Market Risk Report. The foreshortened trading week can affect the number of new 52 week highs and lows and total issues traded. It can also push shorter term investors (and computer algorithms) to be defensive and move toward cash. This last week’s data shows only the mildest symptoms of the above activities.
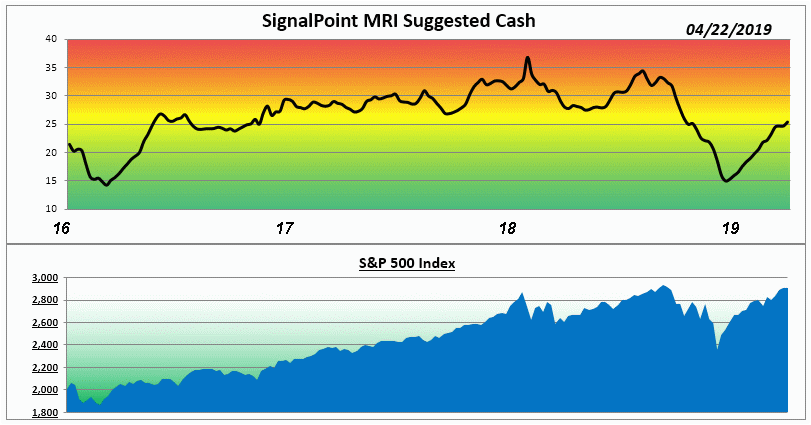
With two Market Risk Indicator (MRI) components up and two down we again this week see the overall MRI unchanged and neutral in its rank. It’s suggested cash level for diversified stock investments is 25%. The MRI Oscillator shows a bit more rising risk pressure at +4 this week. Here’s how it looks:

The MRI remains just below its long term median value (26%) at this point and significantly below its 2018 peak even though major market indexes are now back near previous highs seen last year.”
The Market Risk Indicator is an assessment tool that serves as a guide through all markets as to the prudent use of a liquid cash cushion. It helps determine an approximation of the amount of cash reserve relative to a diversified equity portfolio. (this is depicted by the graph above)
At times of high risk in the market, the MRI will suggest a higher level of cash reserve. At times of low market risk, the MRI will suggest a lower level of cash reserve. This investment process helps to measure and manage market risk.
Because of this, the fear associated with the uncertainty of the market can be replaced by the security of a sound investment strategy.


