From Chief Investment Officer Tom Veale,
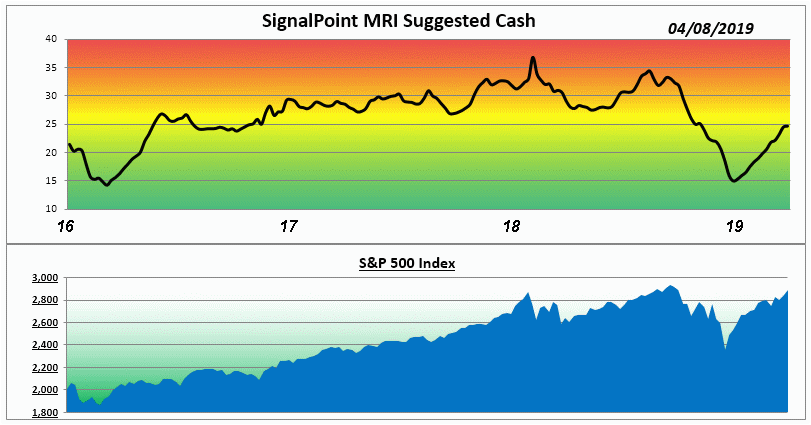
“Upward pressure on market risk eased this week. The Market Risk Indicator (MRI) rose one point to 25% suggested cash for diversified stock portfolios while the MRI Oscillator came in at +2. The lower MRI Oscillator value suggests we’ll see a slowing rise going forward.
Two MRI components rose slightly while two dropped. All are currently in their own neutral ranges as is the overall MRI reading. The last time the S&P 500 was this high, market risk (as measured by our MRI) was quite a bit higher. This would indicate we may have modest upside growth available.
Advancing stocks last week outnumbered decliners by over 2:1 ratio. The number of new 52 week highs eclipsed the new lows by a substantial margin as well. Both of these statistics indicate reasonable health for the markets. I noted that we had healthy gains in both domestic and international stock ETFs last week. This suggests the “trade war” dialog is less threatening than it had been.”

The Market Risk Indicator (MRI) is an assessment tool that serves as a guide through all markets as to the prudent use of a liquid cash cushion. It helps determine an approximation of the amount of cash reserve relative to a diversified equity portfolio. (this is depicted by the graph above)
At times of high risk in the market, the MRI will suggest a higher level of cash reserve. At times of low market risk, the MRI will suggest a lower level of cash reserve. This investment process helps to measure and manage market risk.
Because of this, the fear associated with the uncertainty of the market can be replaced by the security of a sound investment strategy.


